---
title: Glances
description: Glances Widget Configuration
---
 _(Find the Glances information widget [here](../services/glances.md))_
The Glances widget allows you to monitor the resources (cpu, memory, diskio, sensors & processes) of host or another machine. You can have multiple instances by adding another service block.
```yaml
widget:
type: glances
url: http://glances.host.or.ip:port
username: user # optional if auth enabled in Glances
password: pass # optional if auth enabled in Glances
metric: cpu
```
_Please note, this widget does not need an `href`, `icon` or `description` on its parent service. To achive the same effect as the examples above, see as an example:_
```yaml
- CPU Usage:
widget:
type: glances
url: http://glances.host.or.ip:port
metric: cpu
- Network Usage:
widget:
type: glances
url: http://glances.host.or.ip:port
metric: network:enp0s25
```
## Metrics
The metric field in the configuration determines the type of system monitoring data to be displayed. Here are the supported metrics:
`info`: System information. Shows the system's hostname, OS, kernel version, CPU type, CPU usage, RAM usage and SWAP usage.
`cpu`: CPU usage. Shows how much of the system's computational resources are currently being used.
`memory`: Memory usage. Shows how much of the system's RAM is currently being used.
`process`: Top 5 processes based on CPU usage. Gives an overview of which processes are consuming the most resources.
`network:`: Network data usage for the specified interface. Replace `` with the name of your network interface, e.g., `network:enp0s25`, as specificed in glances.
`sensor:`: Temperature of the specified sensor, typically used to monitor CPU temperature. Replace `` with the name of your sensor, e.g., `sensor:Package id 0` as specificed in glances.
`disk:`: Disk I/O data for the specified disk. Replace `` with the id of your disk, e.g., `disk:sdb`, as specificed in glances.
`gpu:`: GPU usage for the specified GPU. Replace `` with the id of your GPU, e.g., `gpu:0`, as specificed in glances.
`fs:`: Disk usage for the specified mount point. Replace `` with the path of your disk, e.g., `/mnt/storage`, as specificed in glances.
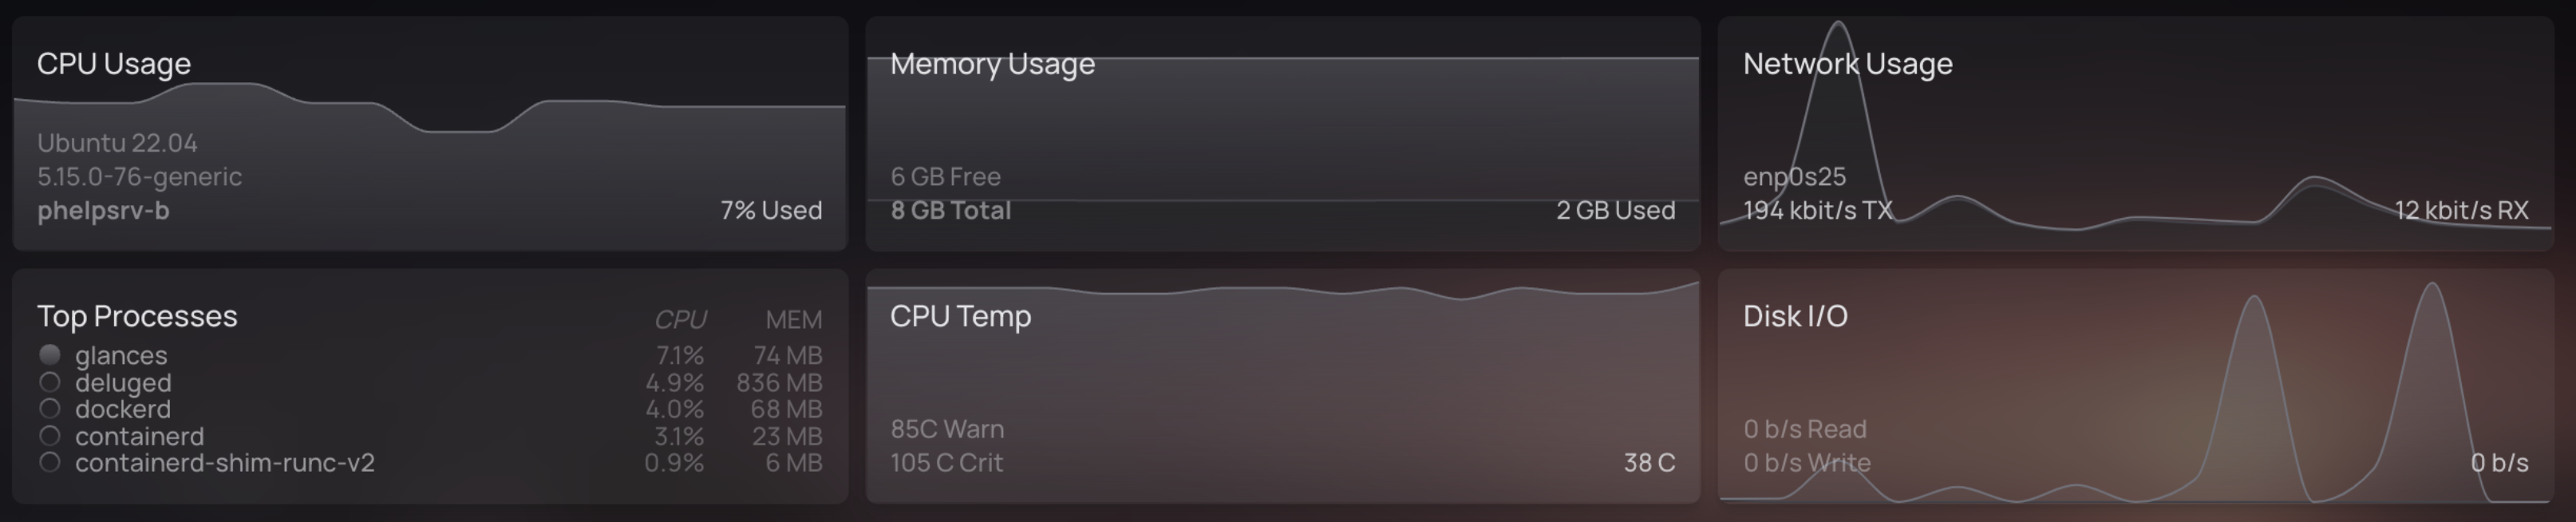
## Views
All widgets offer an alternative to the full or "graph" view, which is the compact, or "graphless" view.
_(Find the Glances information widget [here](../services/glances.md))_
The Glances widget allows you to monitor the resources (cpu, memory, diskio, sensors & processes) of host or another machine. You can have multiple instances by adding another service block.
```yaml
widget:
type: glances
url: http://glances.host.or.ip:port
username: user # optional if auth enabled in Glances
password: pass # optional if auth enabled in Glances
metric: cpu
```
_Please note, this widget does not need an `href`, `icon` or `description` on its parent service. To achive the same effect as the examples above, see as an example:_
```yaml
- CPU Usage:
widget:
type: glances
url: http://glances.host.or.ip:port
metric: cpu
- Network Usage:
widget:
type: glances
url: http://glances.host.or.ip:port
metric: network:enp0s25
```
## Metrics
The metric field in the configuration determines the type of system monitoring data to be displayed. Here are the supported metrics:
`info`: System information. Shows the system's hostname, OS, kernel version, CPU type, CPU usage, RAM usage and SWAP usage.
`cpu`: CPU usage. Shows how much of the system's computational resources are currently being used.
`memory`: Memory usage. Shows how much of the system's RAM is currently being used.
`process`: Top 5 processes based on CPU usage. Gives an overview of which processes are consuming the most resources.
`network:`: Network data usage for the specified interface. Replace `` with the name of your network interface, e.g., `network:enp0s25`, as specificed in glances.
`sensor:`: Temperature of the specified sensor, typically used to monitor CPU temperature. Replace `` with the name of your sensor, e.g., `sensor:Package id 0` as specificed in glances.
`disk:`: Disk I/O data for the specified disk. Replace `` with the id of your disk, e.g., `disk:sdb`, as specificed in glances.
`gpu:`: GPU usage for the specified GPU. Replace `` with the id of your GPU, e.g., `gpu:0`, as specificed in glances.
`fs:`: Disk usage for the specified mount point. Replace `` with the path of your disk, e.g., `/mnt/storage`, as specificed in glances.
## Views
All widgets offer an alternative to the full or "graph" view, which is the compact, or "graphless" view.
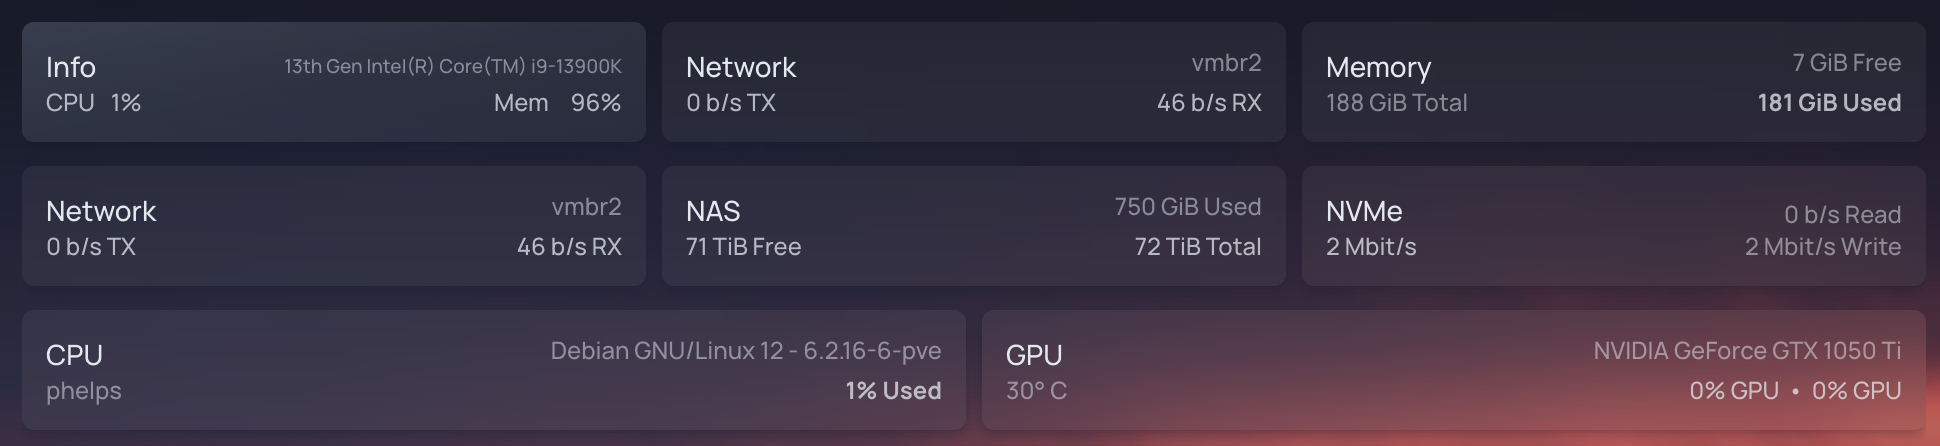 To switch to the alternative "graphless" view, simply passs `chart: false` as an option to the widget, like so:
```yaml
- Network Usage:
widget:
type: glances
url: http://glances.host.or.ip:port
metric: network:enp0s25
chart: false
```
To switch to the alternative "graphless" view, simply passs `chart: false` as an option to the widget, like so:
```yaml
- Network Usage:
widget:
type: glances
url: http://glances.host.or.ip:port
metric: network:enp0s25
chart: false
```